Dashboards
INTRODUCTION TO AMS DASHBOARDS
Dashboards are highly customized, interactive reports that make data more accessible and visually meaningful to those tasked to interpret the data. They can display data from any number of forms to give users quick and easy access to the most relevant information to them. Most professional users will have a dashboard on their homepage that summarises the core forms related to their discipline; it is recommended that users make use of these front page dashboards to easily view, interrogate and access existing records.
You can access the full range of dashboards available to your account by clicking on the "DASHBOARDS" link at the top of the page.
Dashboards that you intend to view often can be made "Favourite Dashboards" through your "Account" page; these dashboards will then have their own button on your homepage from where you can access them from a single click:
You may also be able to view dashboards on your AMS home page, depending on what permissions and settings are assigned to your account.
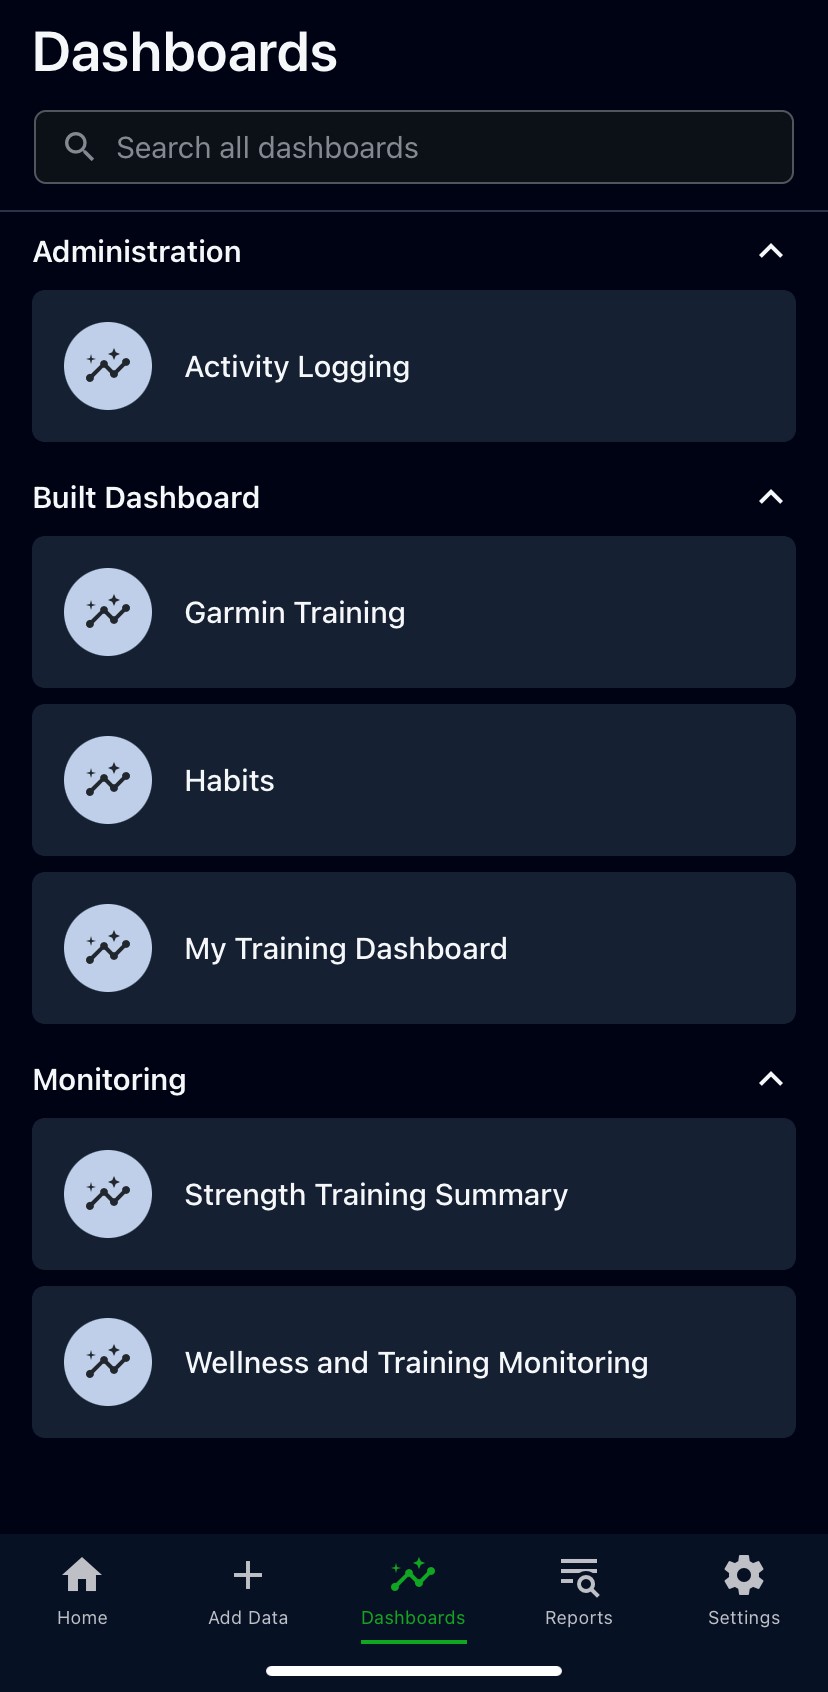
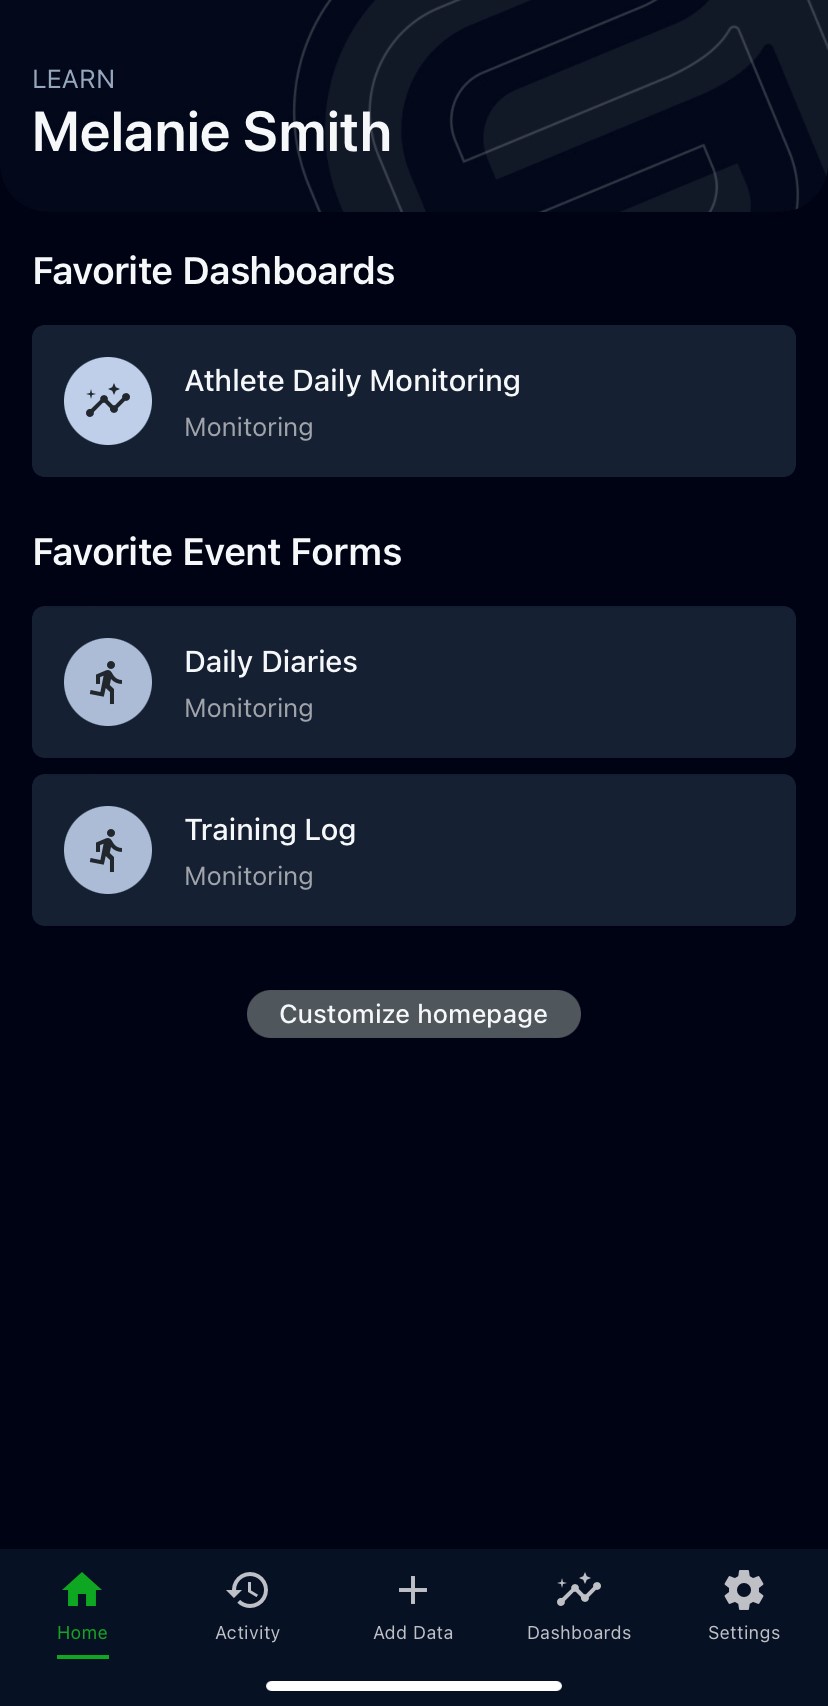
You can also view dashboards on the AMS app through the "Dashboards" tab. You can also select your own favourite dashboards on the home tab if you've enabled the widget in your customized home screen layout.
COMMON FEATURES OF AMS DASHBOARDS
- CANVASES - Dashboards can contain one or more canvases; these are essentially pages and act like tabs in Excel. If more than one canvas is available, you will be able to navigate between them by clicking on the headings at the top of the dashboard.
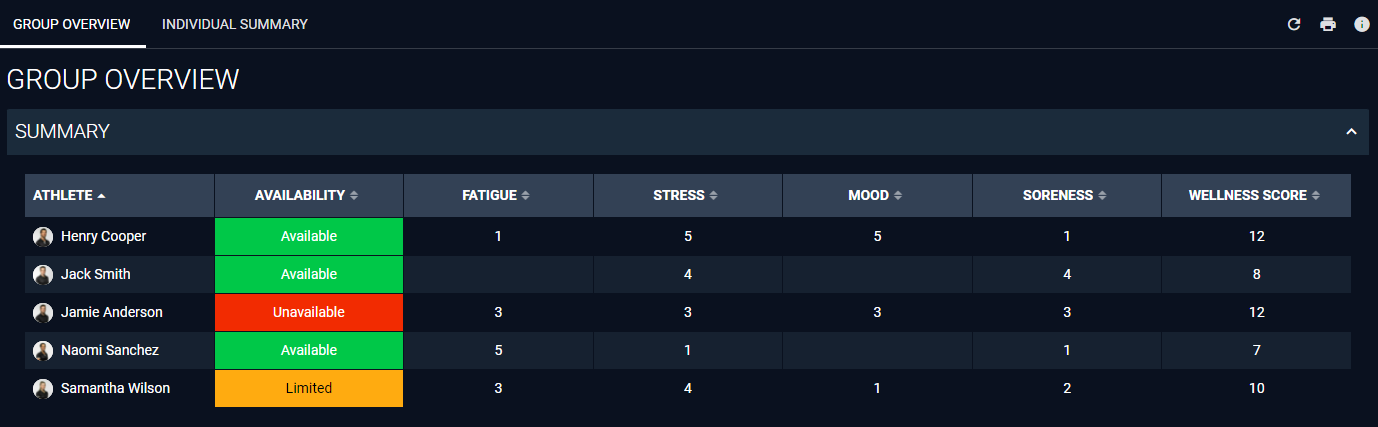
The example above is set up like many dashboards on AMS whereby the first canvas displays a group summary and a second canvas delves deeper into an individual summary.
- SECTIONS - Sections separate information within a canvas. Note that thee are typically collapsible and on larger dashboards may be collapsed by default.
- FILTER WIDGETS - Most dashboards will have one or more filters that are used to narrow data displayed in the dashboard. These include date pickers, which are typically used to chose start and end dates for data to be visualised, and select boxes that typically filter by categories such as sport, position or even athlete names.
- DATA WIDGETS - Tiles, tables and charts that visualise the data in the dashboard.
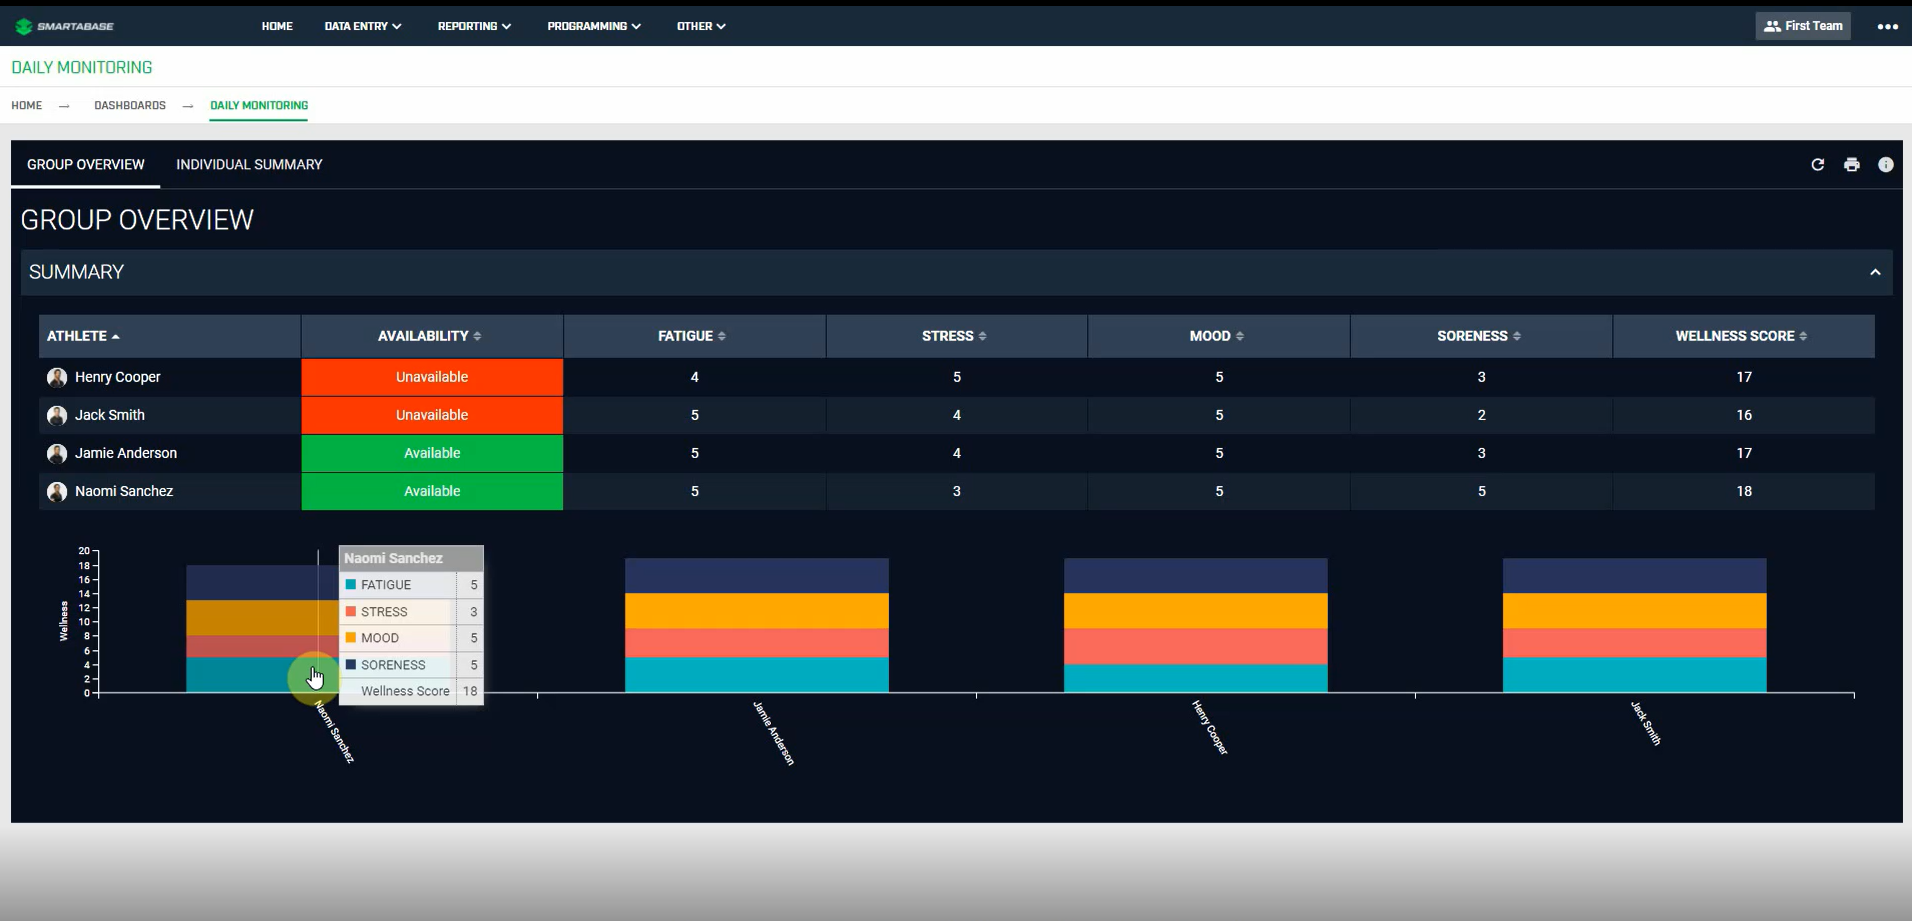
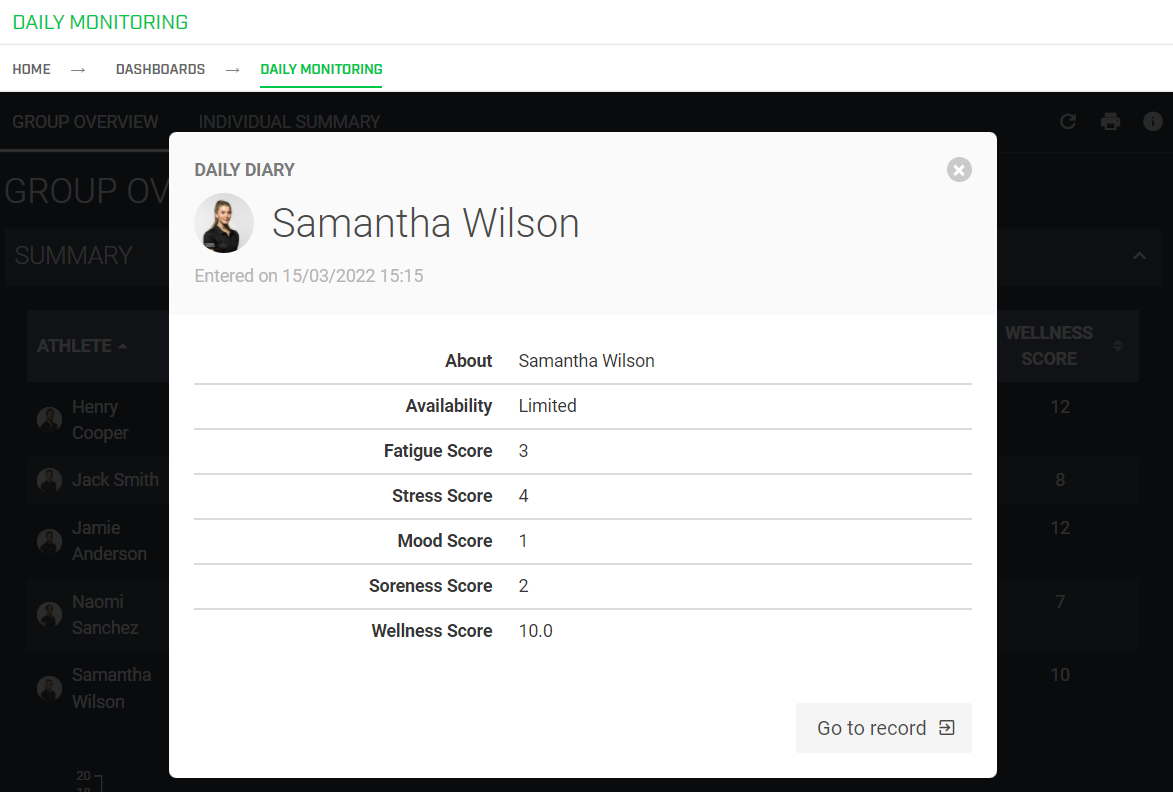
- INTERACTION CARD AND RECORD CLICK THROUGH - Many data widgets are enabled with interaction pop ups and click through capability which offer a great way of viewing further detail and providing context to a number in a table or chart as well as serving as an ideal method of navigating the site and accessing existing records.
MAKING THE BEST USE AMS DASHBOARDS
As mentioned above, the record click through function allows for users to access existing records straight from dashboards. Most practitioner users will have a front page dashboard that summarises the core forms for that user's role; this also allows for quick and easy access to existing records. It is recommended that users take advantage of the dashboard's filtering and interrogation ability to narrow records down to those of interest and click through as needed as opposed to navigating the left hand side bar.